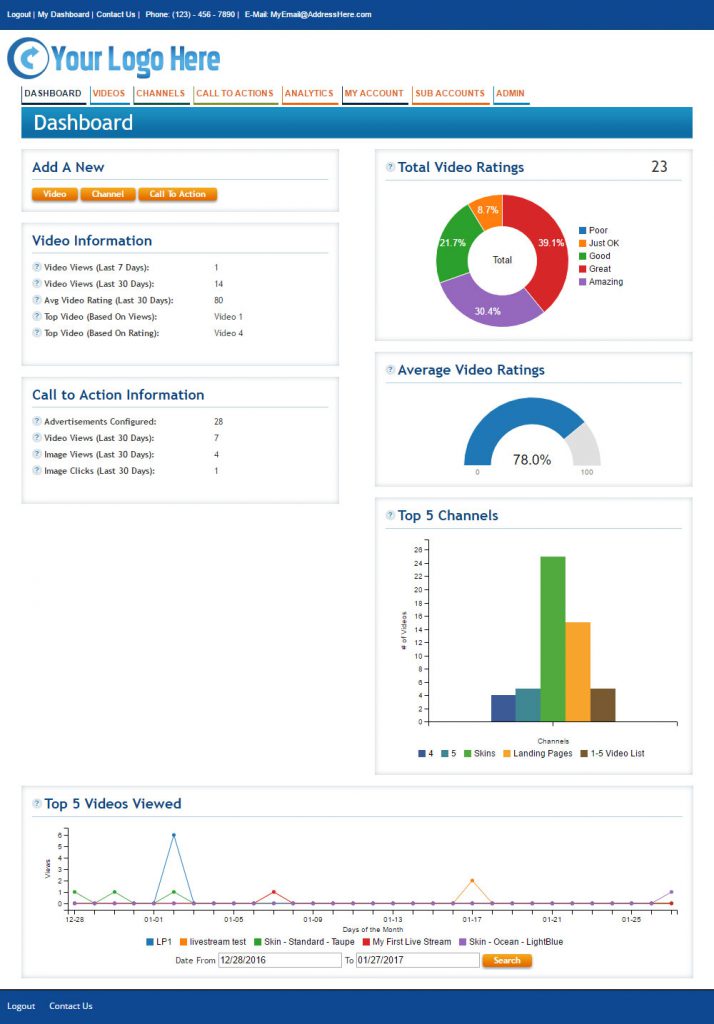
Dashboard Analytics
Access this page by clicking ANALYTICS on the top main toolbar, or DASHBOARD on the same toolbar on the far left. This page is the default page that shows up for a reason. The Analytics Dashboard is your summary page for all analytics on your accounts; Channels, videos and CtA’s. It can be easily viewed as often as you wish to get an at-a-glance performance report of how your entire web video mission is performing. It could even be a good idea to have a dedicated laptop or tablet in your office that is setup to go to this page by default. The data that it reports is updated constantly, and the averages are refreshed each day at 12 midnight US Central Standard Time.
It reveals your average views and ratings based on all of your account’s videos. It also features the top five channels’, top five individual videos’ and top metrics for CtA’s.
For the top five channels viewed it shows accumulative lifetime views, for videos it shows current selected date range views and for CtA’s it shows accumulative number of advertisements configured, and the last thirty days of their views for videos, images and clicks.
Rolling over the graphed video view points reveals a deeper level of specific dates and views.
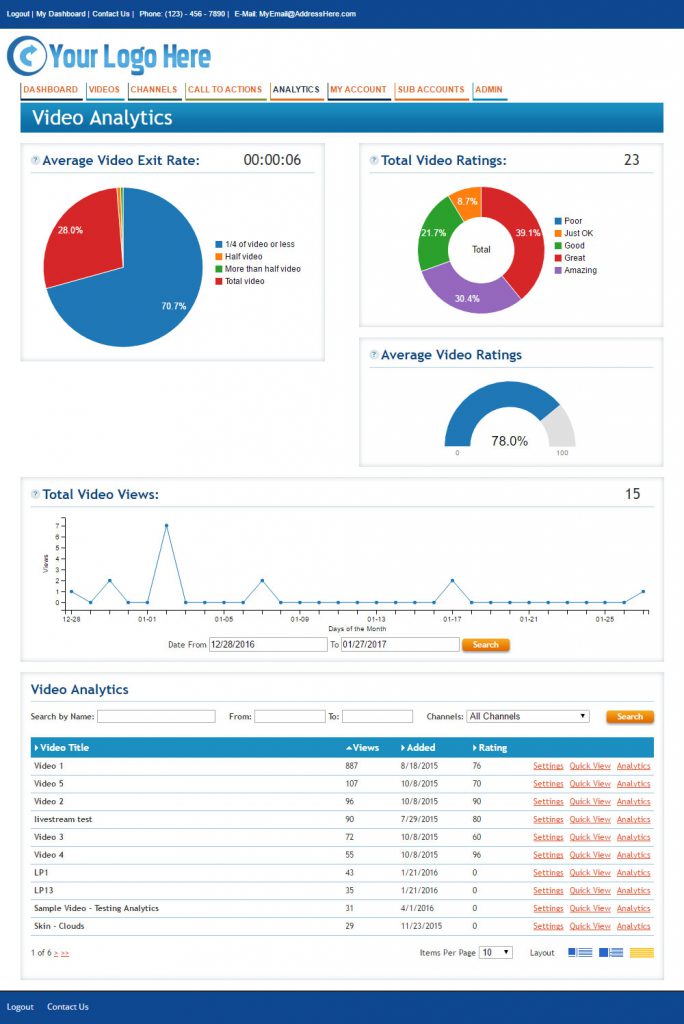
Overall Video Analytics
Access this page by rolling over ANALYTICS on the top main toolbar and clicking on VIDEOS.
The Video Analytics dashboard is a video only report that serves the same function as described above but for videos only and adds the Exit Ratings— no channels or CtA’s. Many users have only small numbers of videos and do not use either channels or CtA’s, thus the Videos Only reporting tool.
An Exit Rate is a report on what percentage of an asset viewers watched. The Exit Rate Pie Chart averages to closest proximity and is not exact.
Rolling over the graphed video view points and pie chart sections reveals a deeper level of specific dates, views and percentages.
The first page of your Video List from your account is attached at the bottom of the Analytics section on the same page. This allows you to quickly choose a specific video form which extract data.
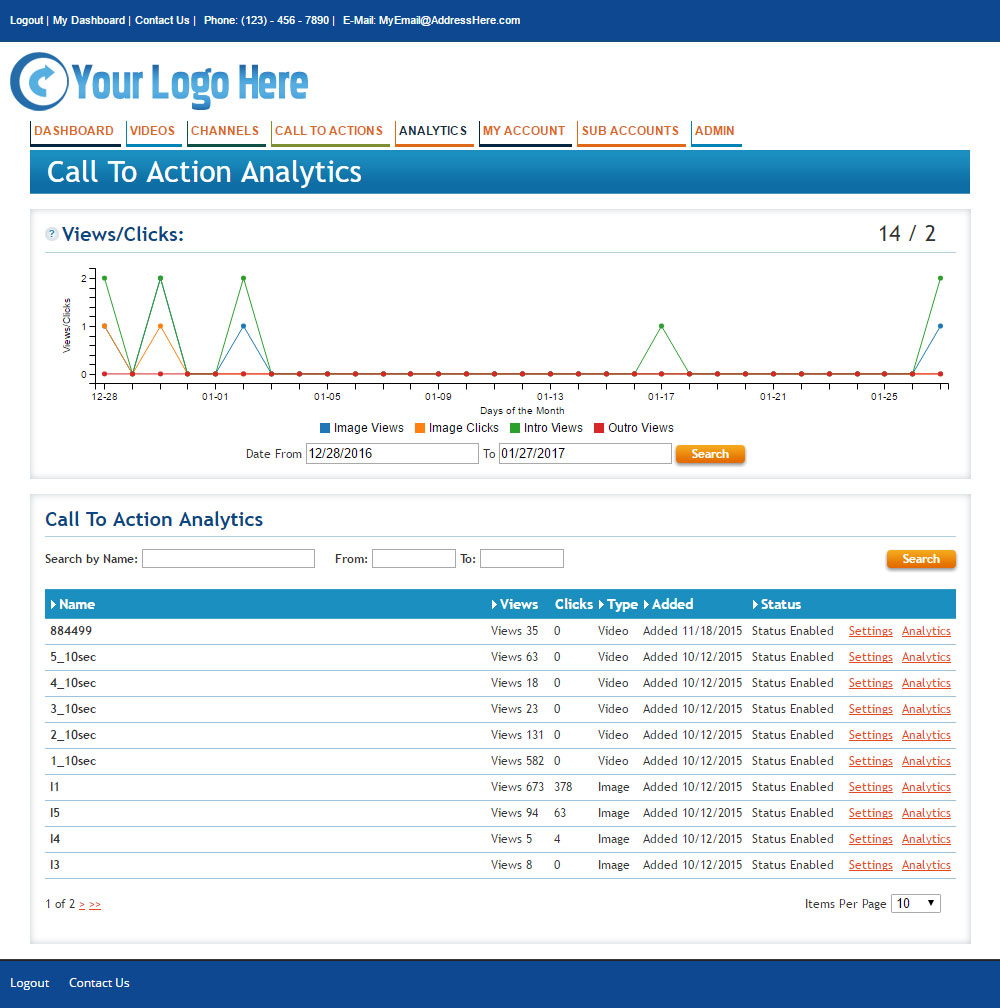
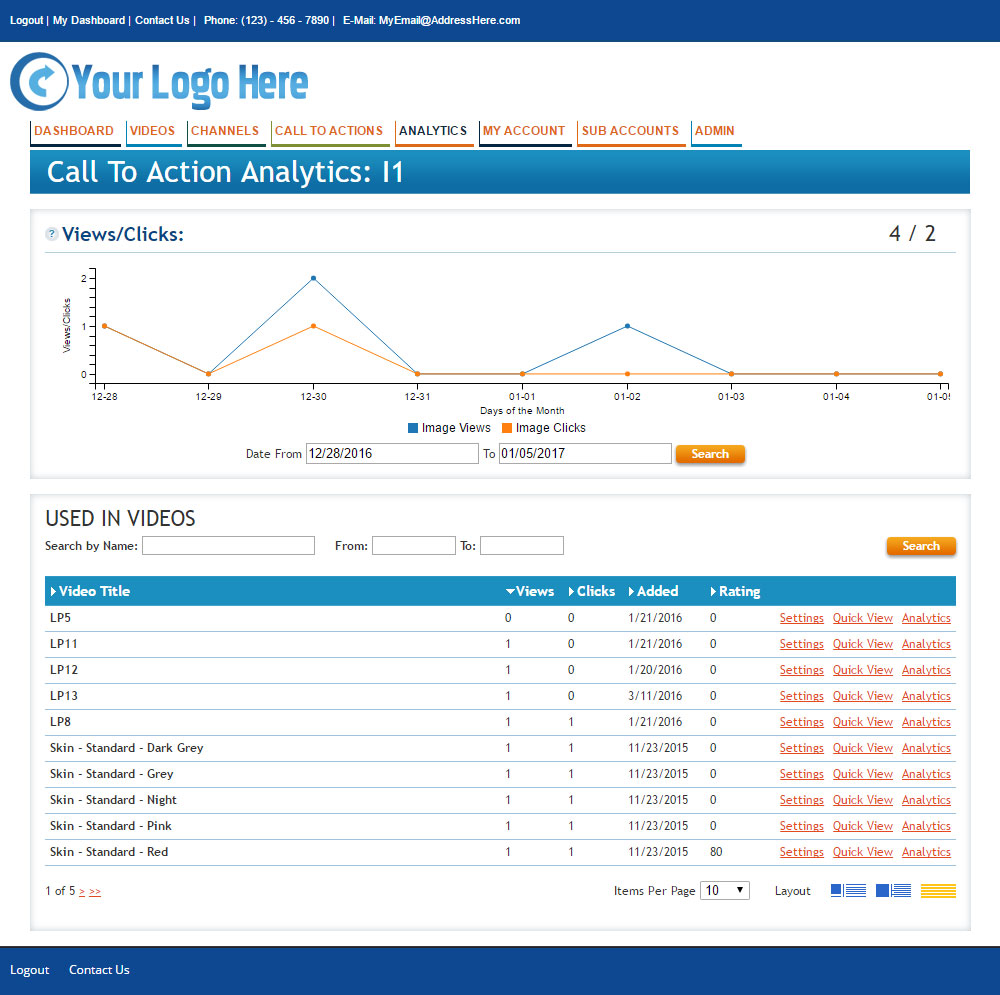
Overall Call To Action Analytics
Access this page by rolling over ANALYTICS on the top main toolbar and clicking on CALL TO ACTION.
Analytics are short pre-roll videos, short post-roll videos and popup images. All three can include hyper-links. This page displays a summary report of metrics for all your CtA’s as well as the top performers.
The Call to Action Analytics page reports on metrics for your CtA advertisements only. The top graphed information is harvested from the top performing advertisements. Results from individual assets can be seen by moving the cursor down into the asset list and clicking on Analytics for that asset.
Notice that the date range located at the bottom of the graph is programmable.
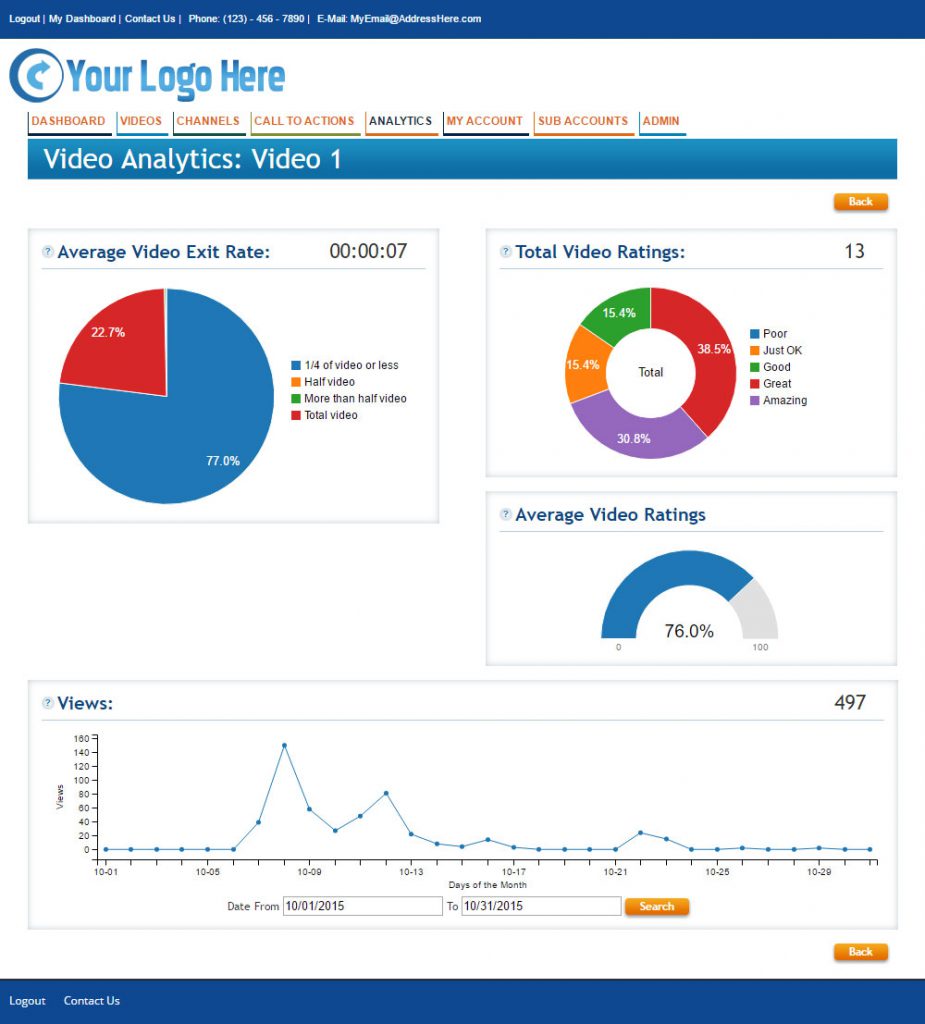
Single Video Analytics
Access this page by clicking ANALYTICS from the Video List.
This page reports on the metrics for only the selected video.
Exit Rate is a report on what percentage of an asset viewers watched. The Exit Rate Pie Chart averages to closest proximity and is not exact.
Rolling over the graphed video view points and pie chart sections reveals a deeper level of specific dates, views and percentages. The date range is changeable.
Single Call To Action Analytics
Access this page by clicking ANALYTICS from the Call to Action List.
This page reports on the metrics for only the selected CtA.
Analytics are short pre-roll videos, short post-roll videos and popup images. All three can include hyper-links. This page displays a summary report of metrics for all your CtA’s as well as the top performers.
Notice that the date range located at the bottom of the graph is programmable.